
Appearance
Analysis Dashboard
The Analysis Dashboard turns the transactions in a bank statement PDF into graphs and trend reports, so you can see your spending patterns at a glance.
Analyze a bank statement
On the Spend Analyser page, click Analyze Now.
Select one or more bank statement PDFs from your computer, or drag and drop them onto the page.
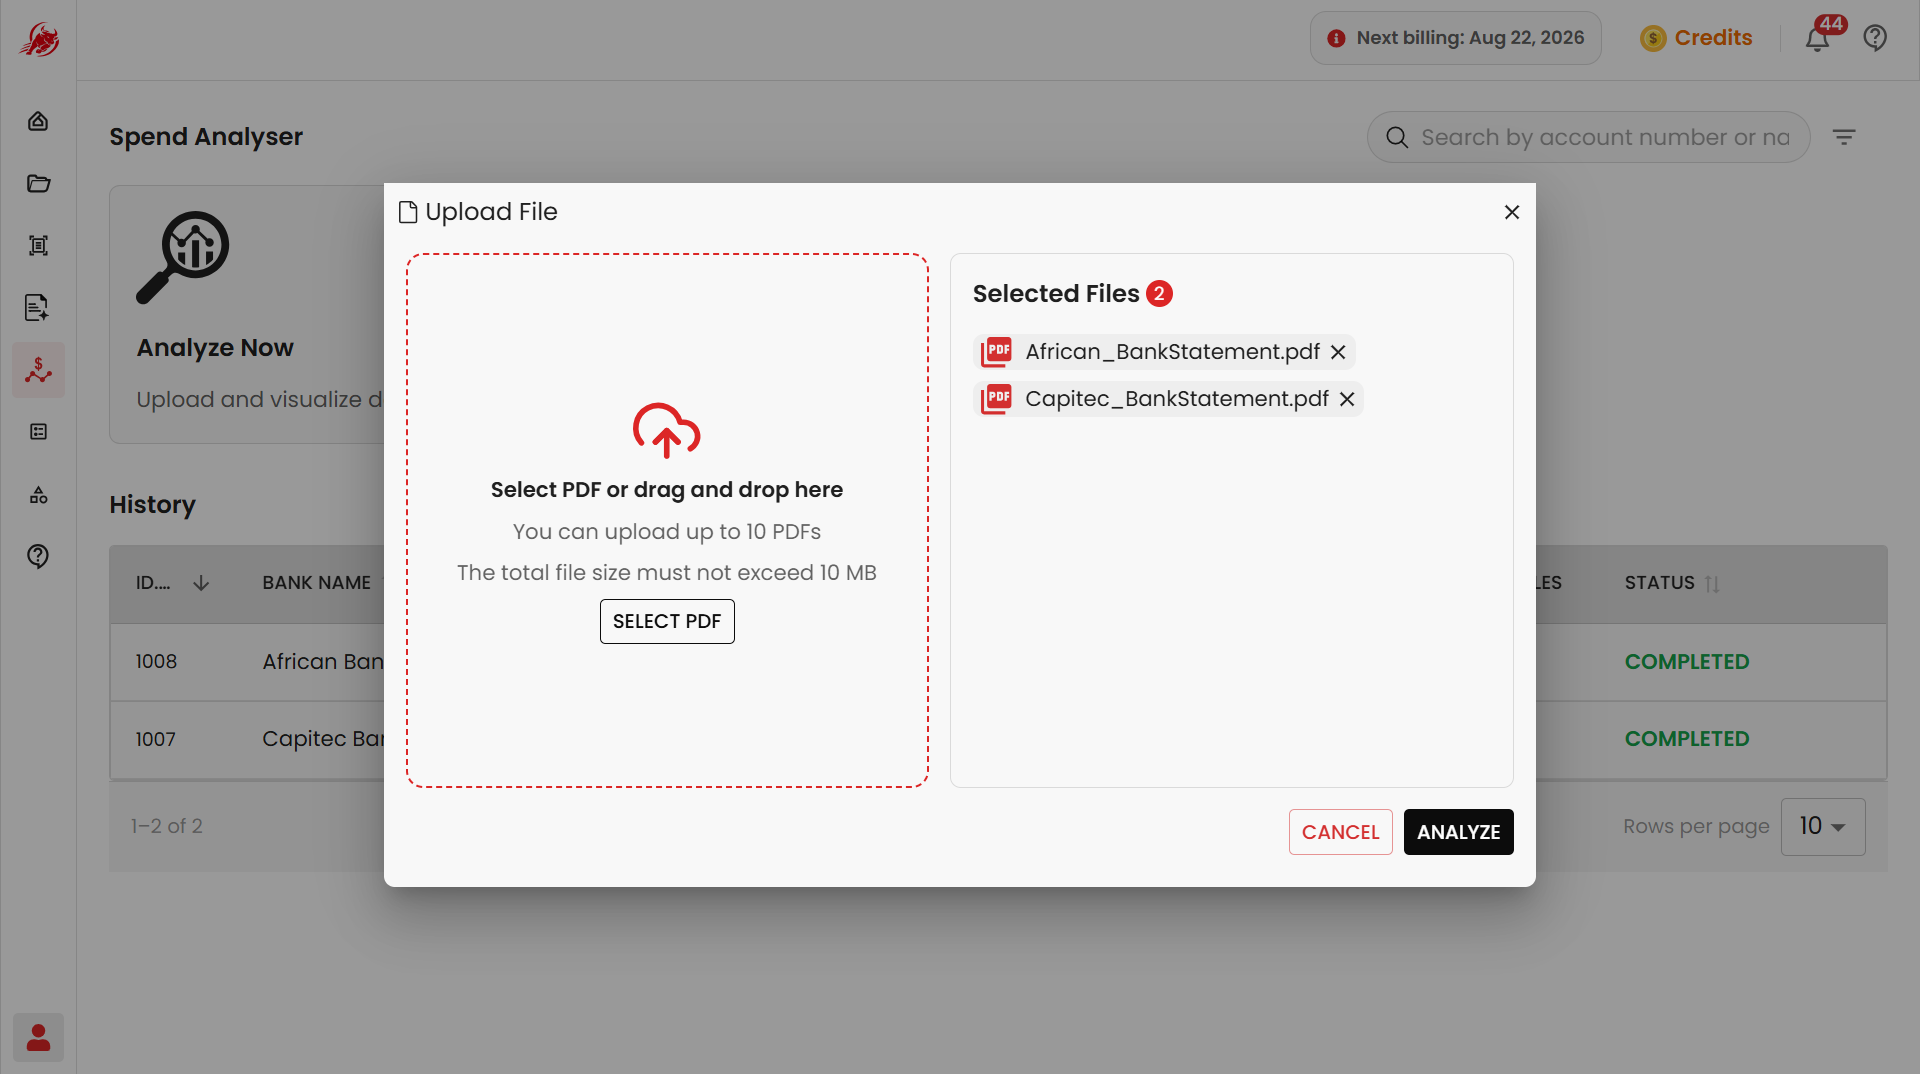
Click Analyze to start processing.
Regoxa reads the transaction data, sorts credits and debits, categorizes your expenses, and builds the dashboard automatically. This can take a moment for larger statements.
Find a past analysis
Use the search box to find a previous analysis by account number or name.
Click the filter icon to narrow the list by status — In Progress, Completed, or Failed — then click Apply.
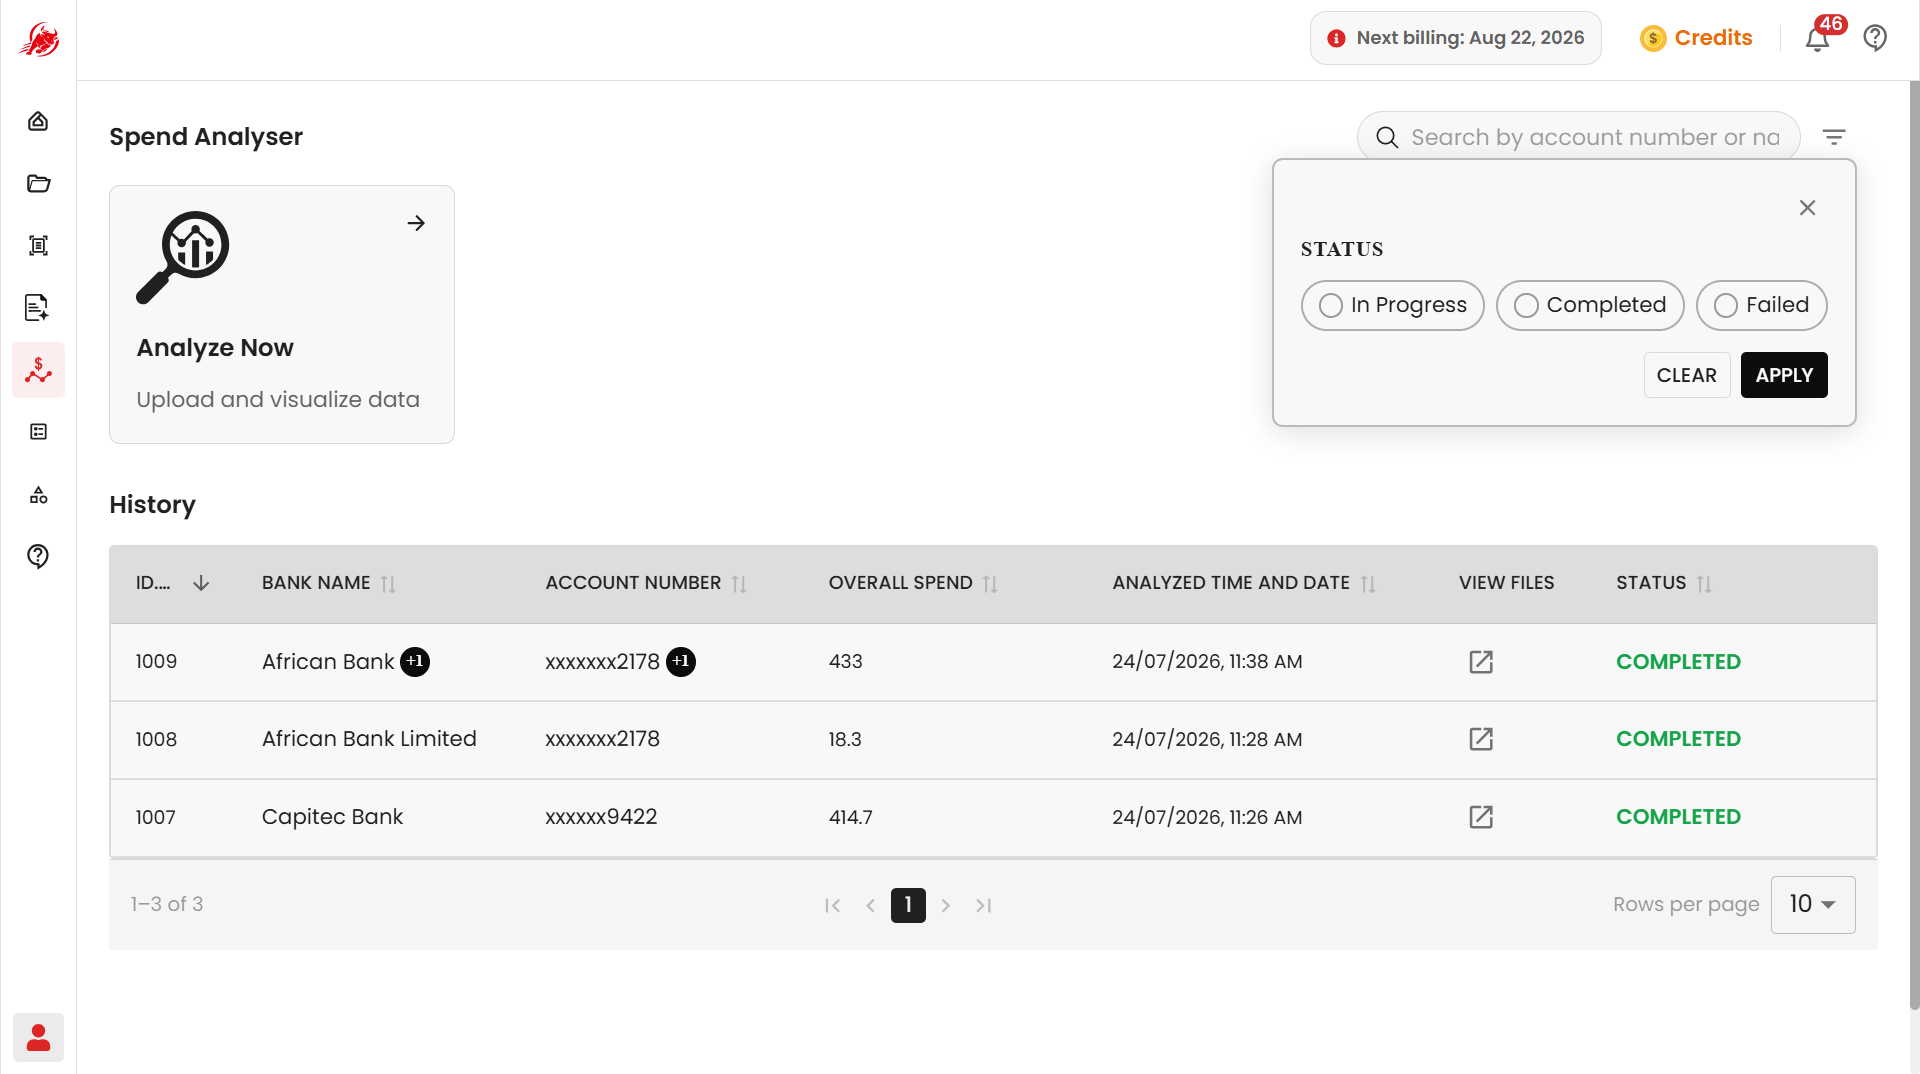
Use the page controls at the bottom of the list to move between pages, and change Rows per page to show more or fewer results at once.
Understand the dashboard
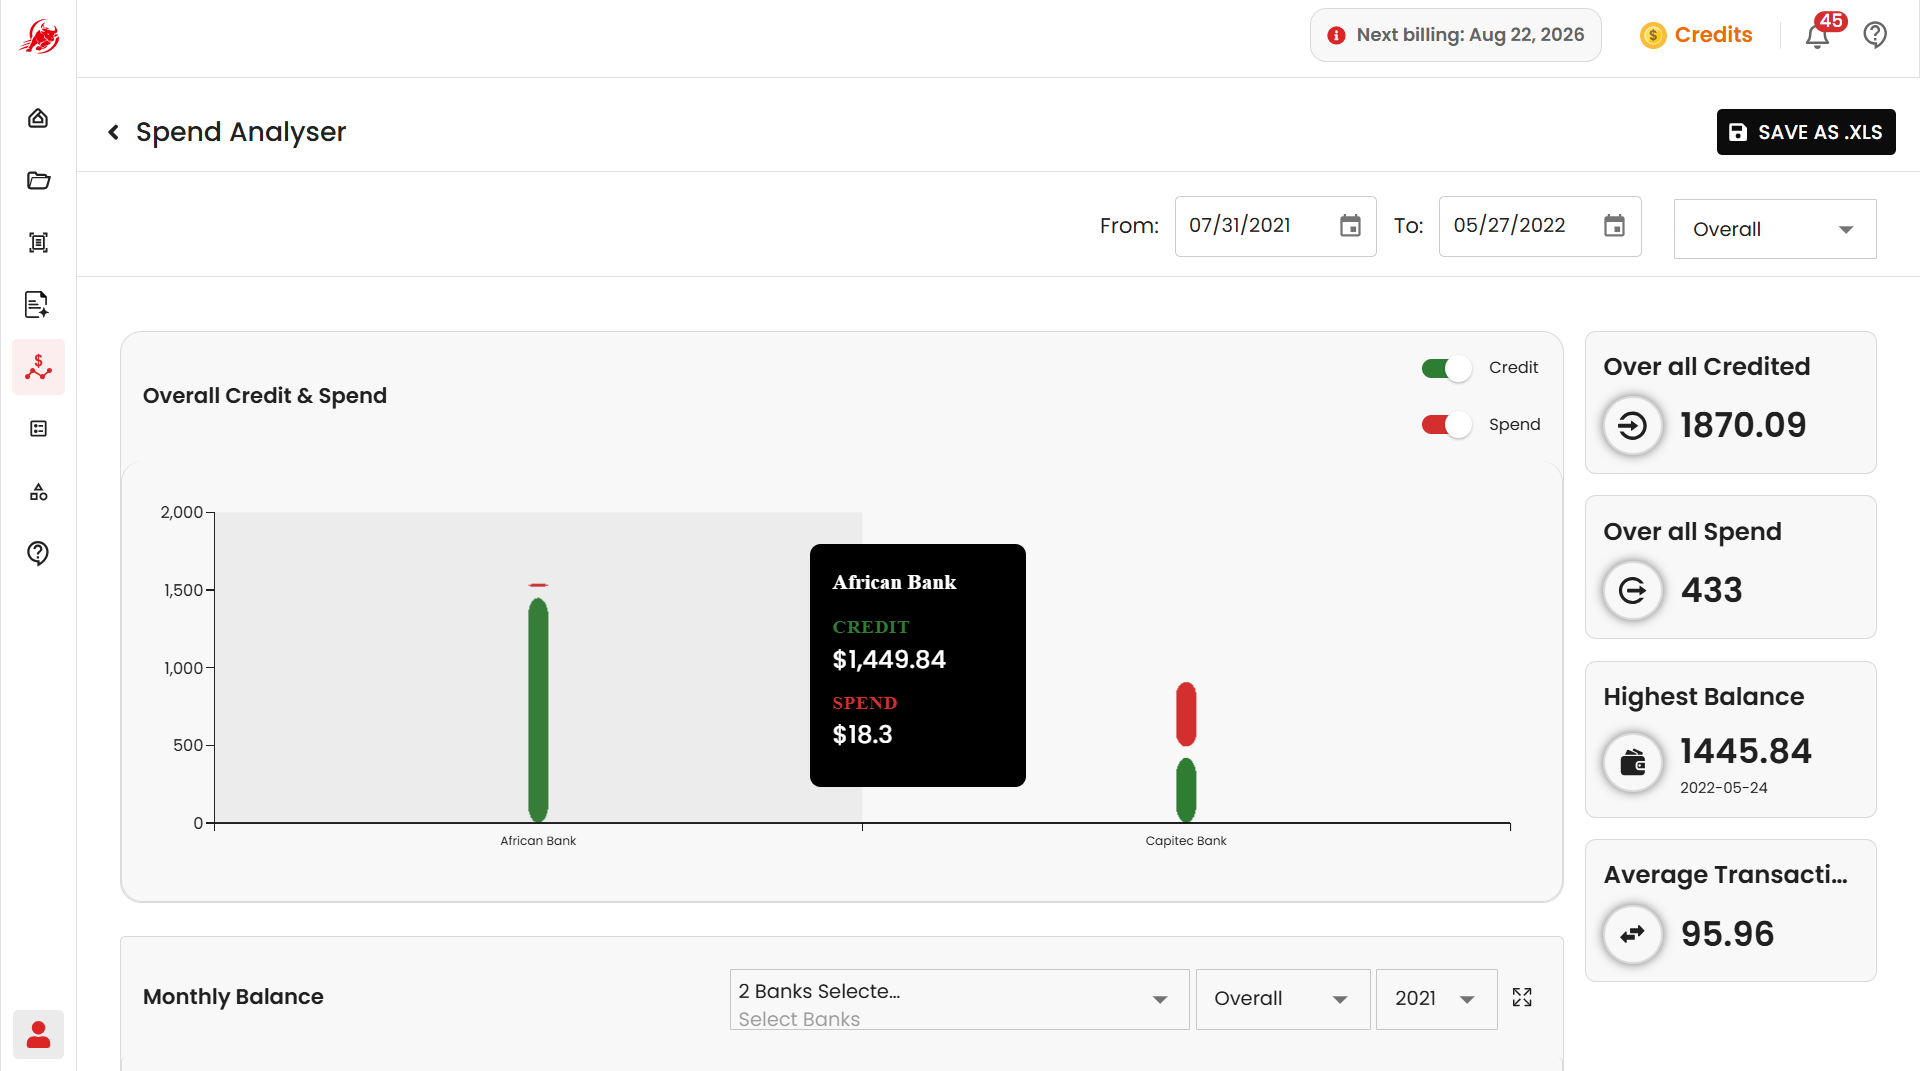
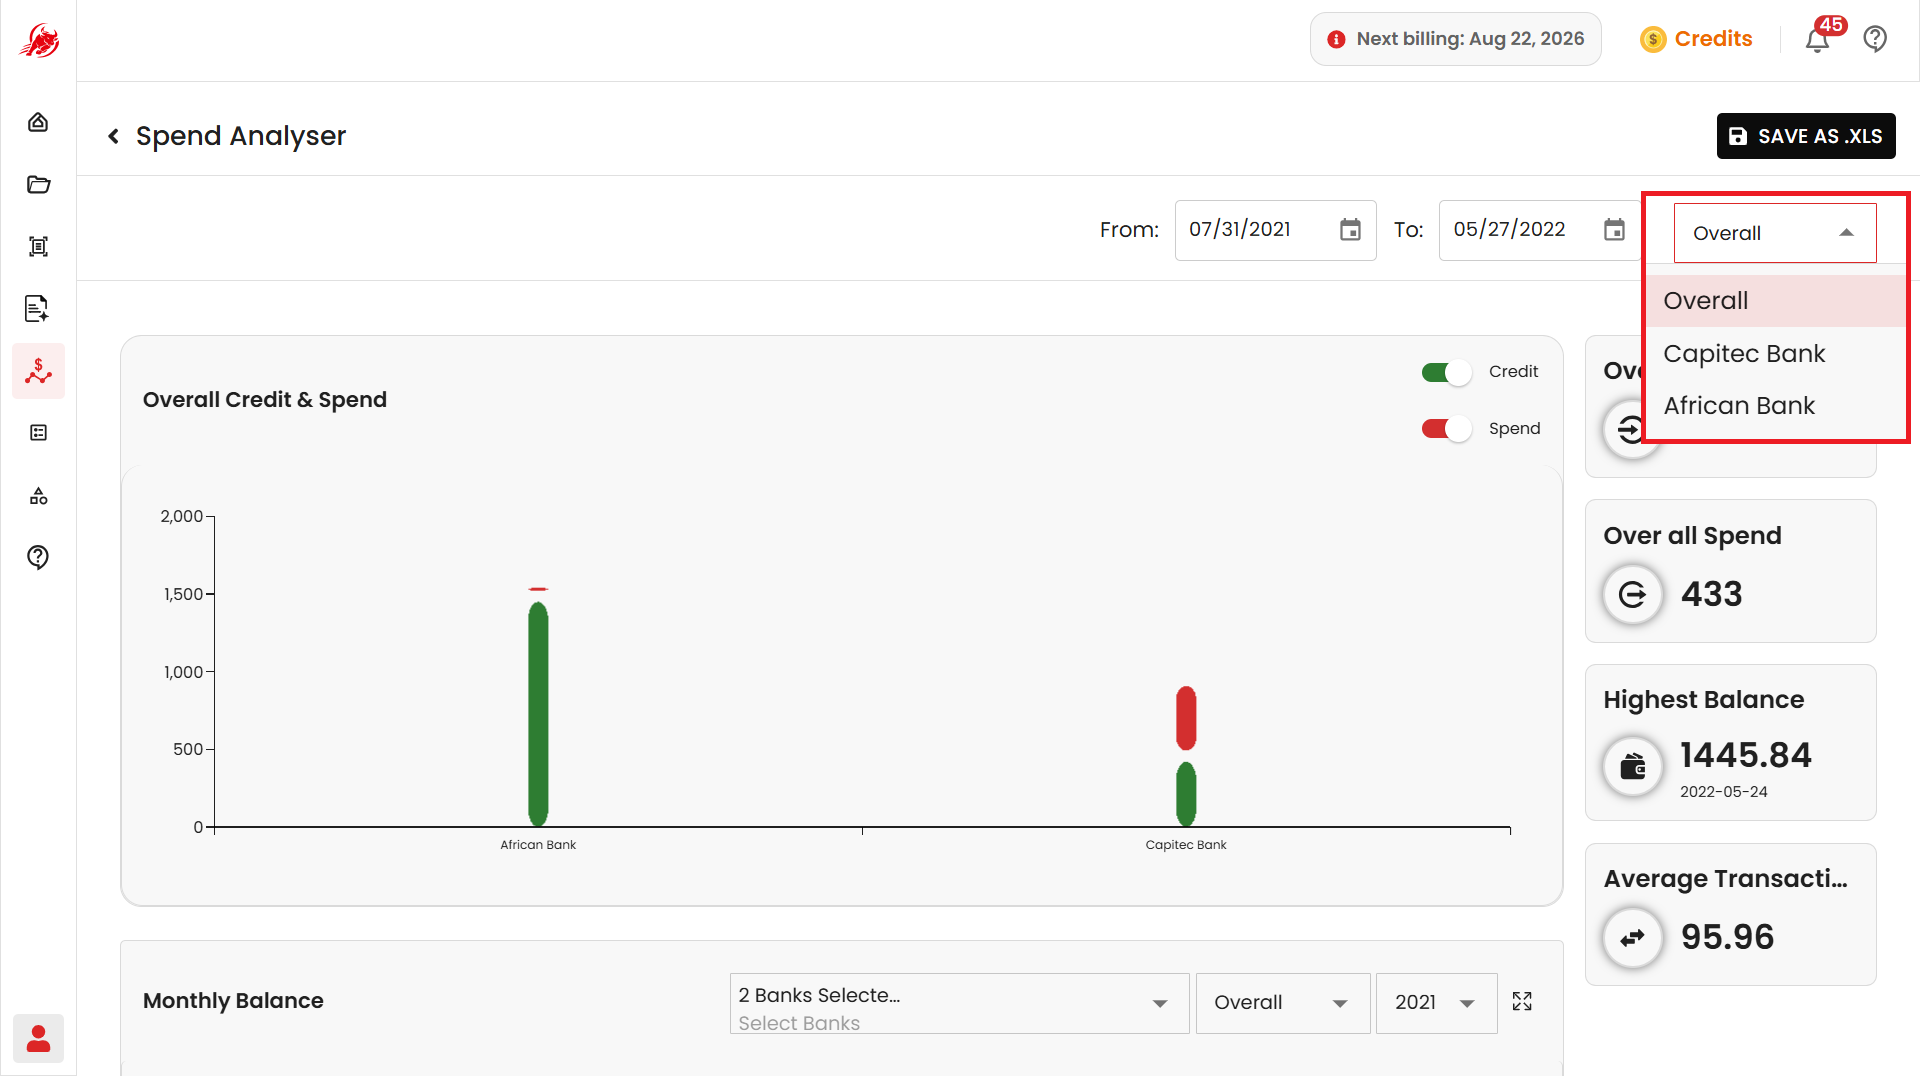
Once processing finishes, the dashboard shows six views of your data. Use the From and To date fields at the top of the page to filter every chart to a specific date range.
Overall Credit vs Debit — total money in versus total money out, for a quick read on cash flow
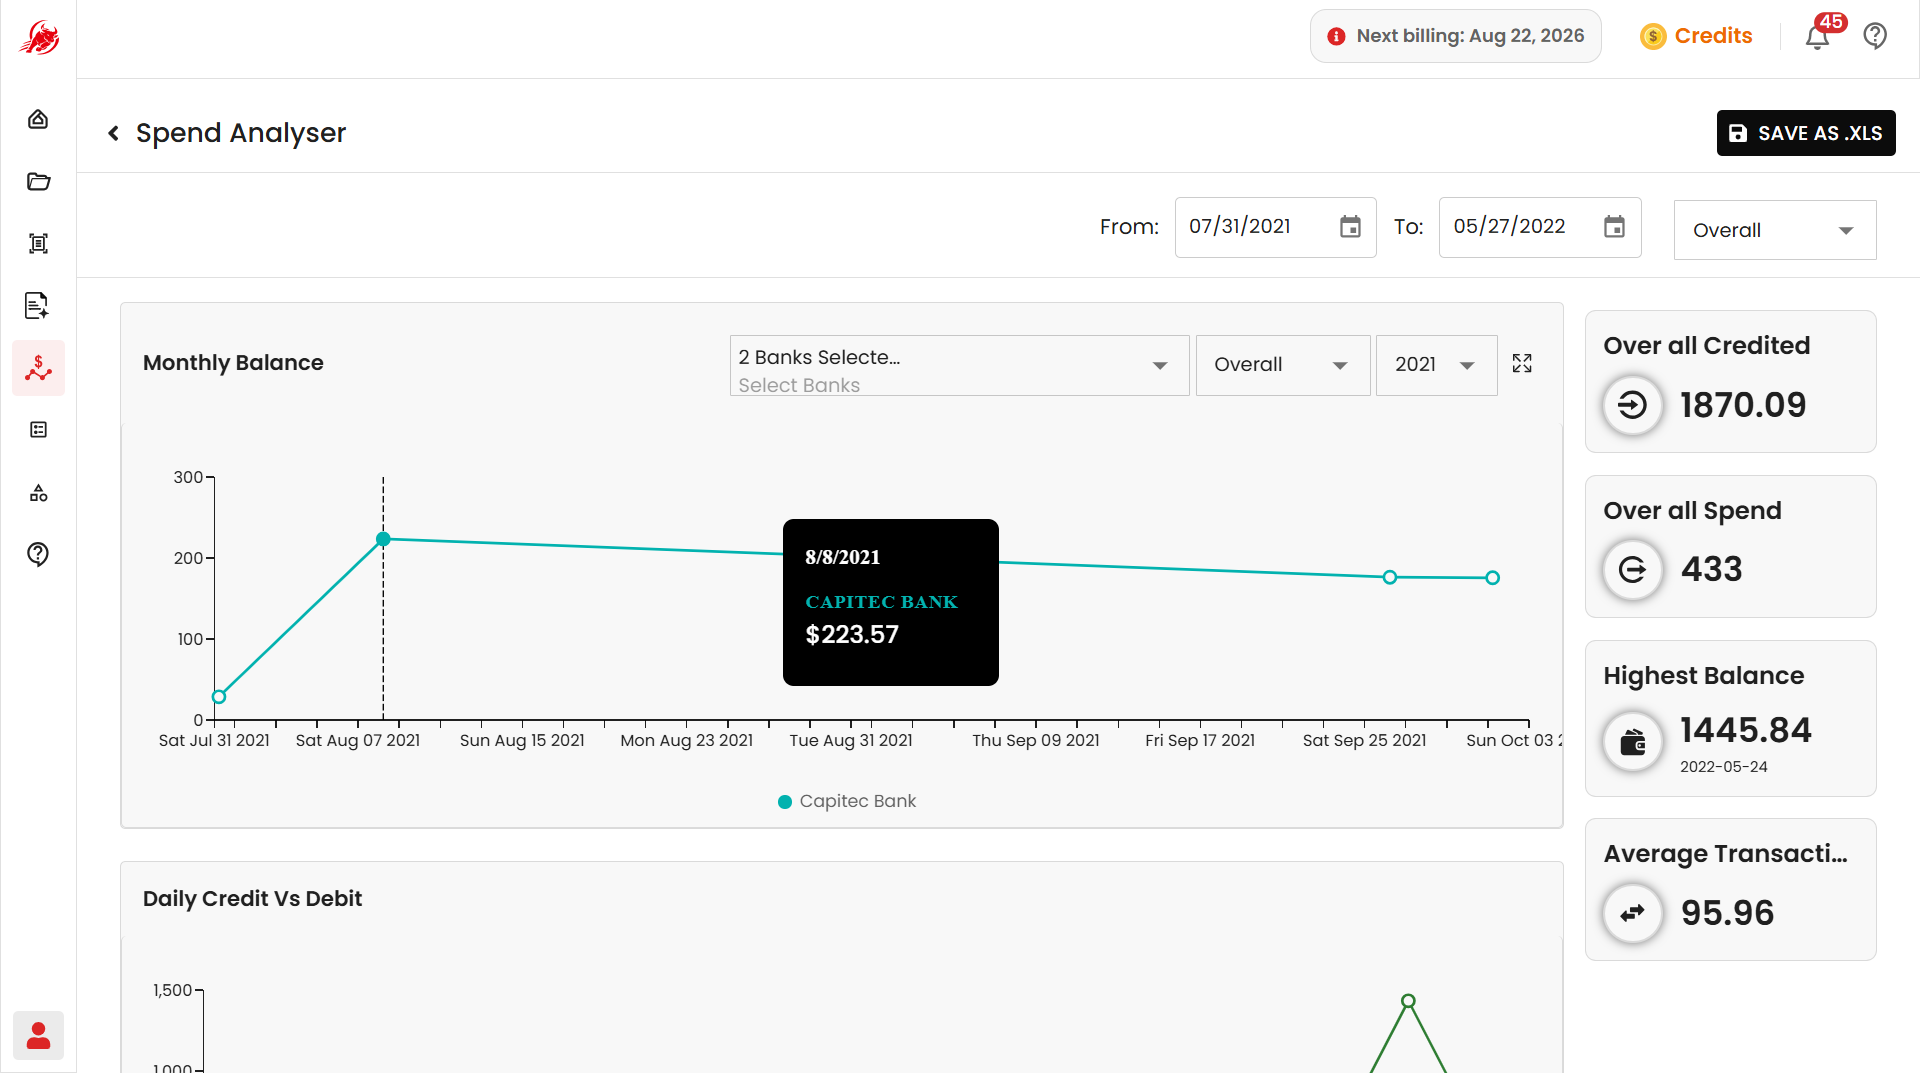
Monthly Balance Trend — how your account balance changes month over month; filter by bank, month, or year to focus on a period
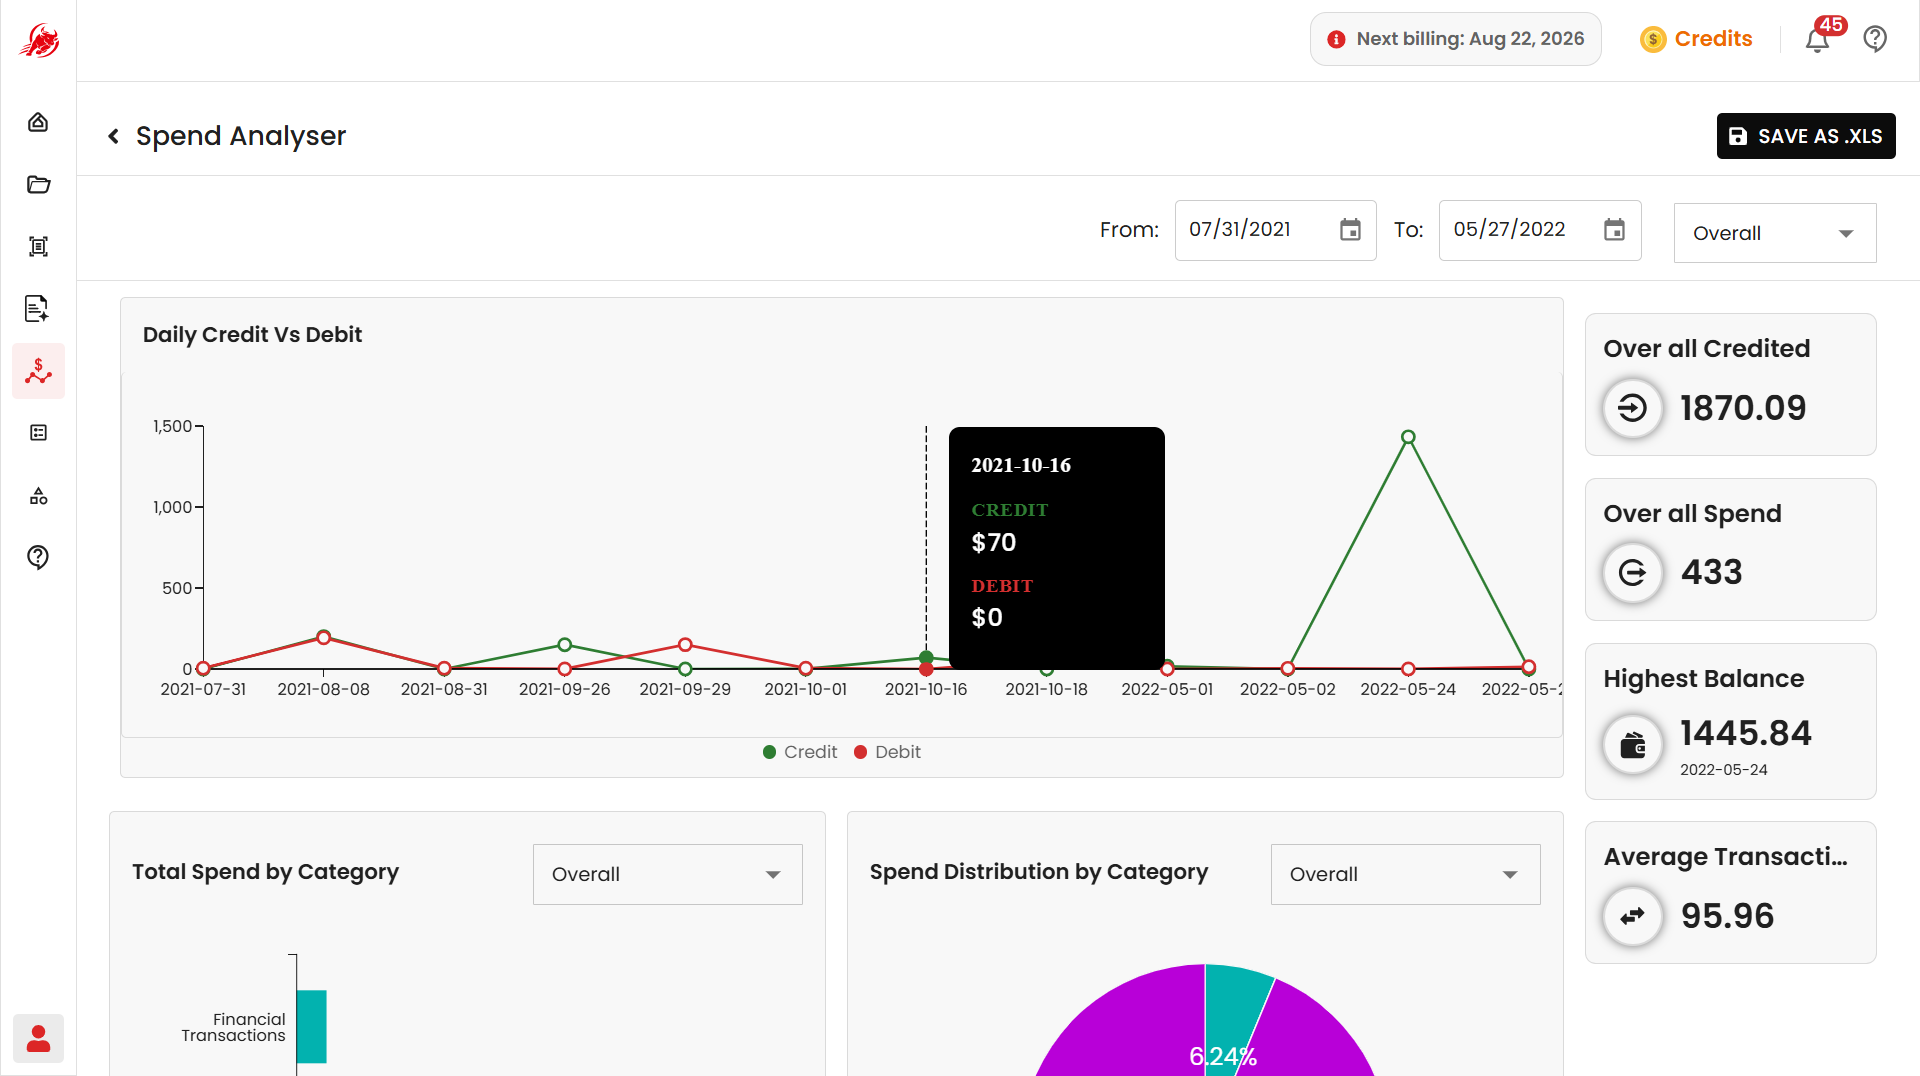
Daily Credit vs Debit — day-by-day money in versus out, useful for spotting short-term spikes
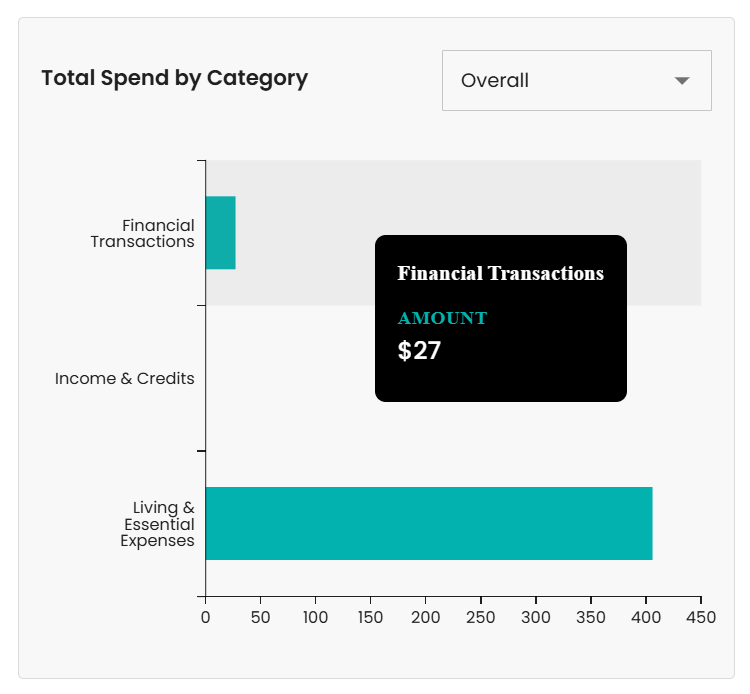
Spend by Category — your expenses grouped into categories like food, travel, shopping, bills, and entertainment
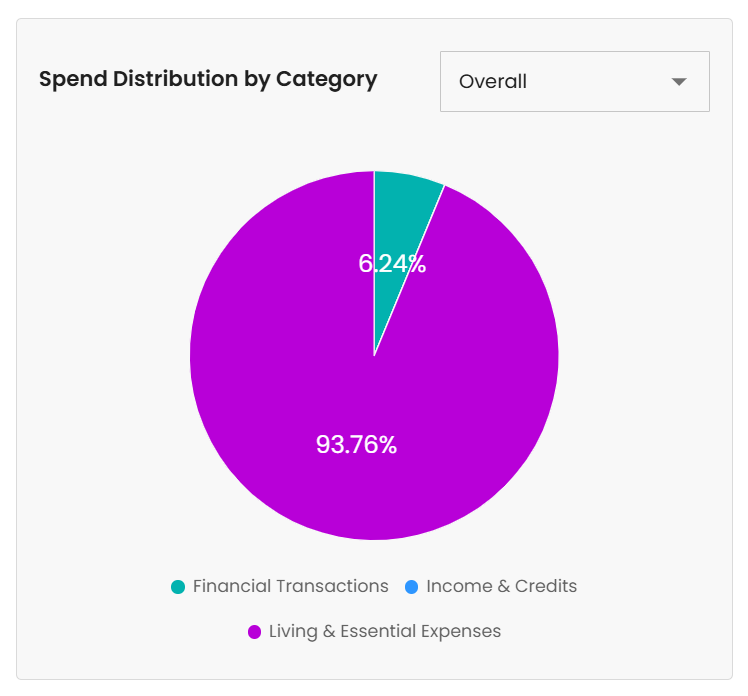
Spend Distribution — each category's share of your total spend, as a percentage
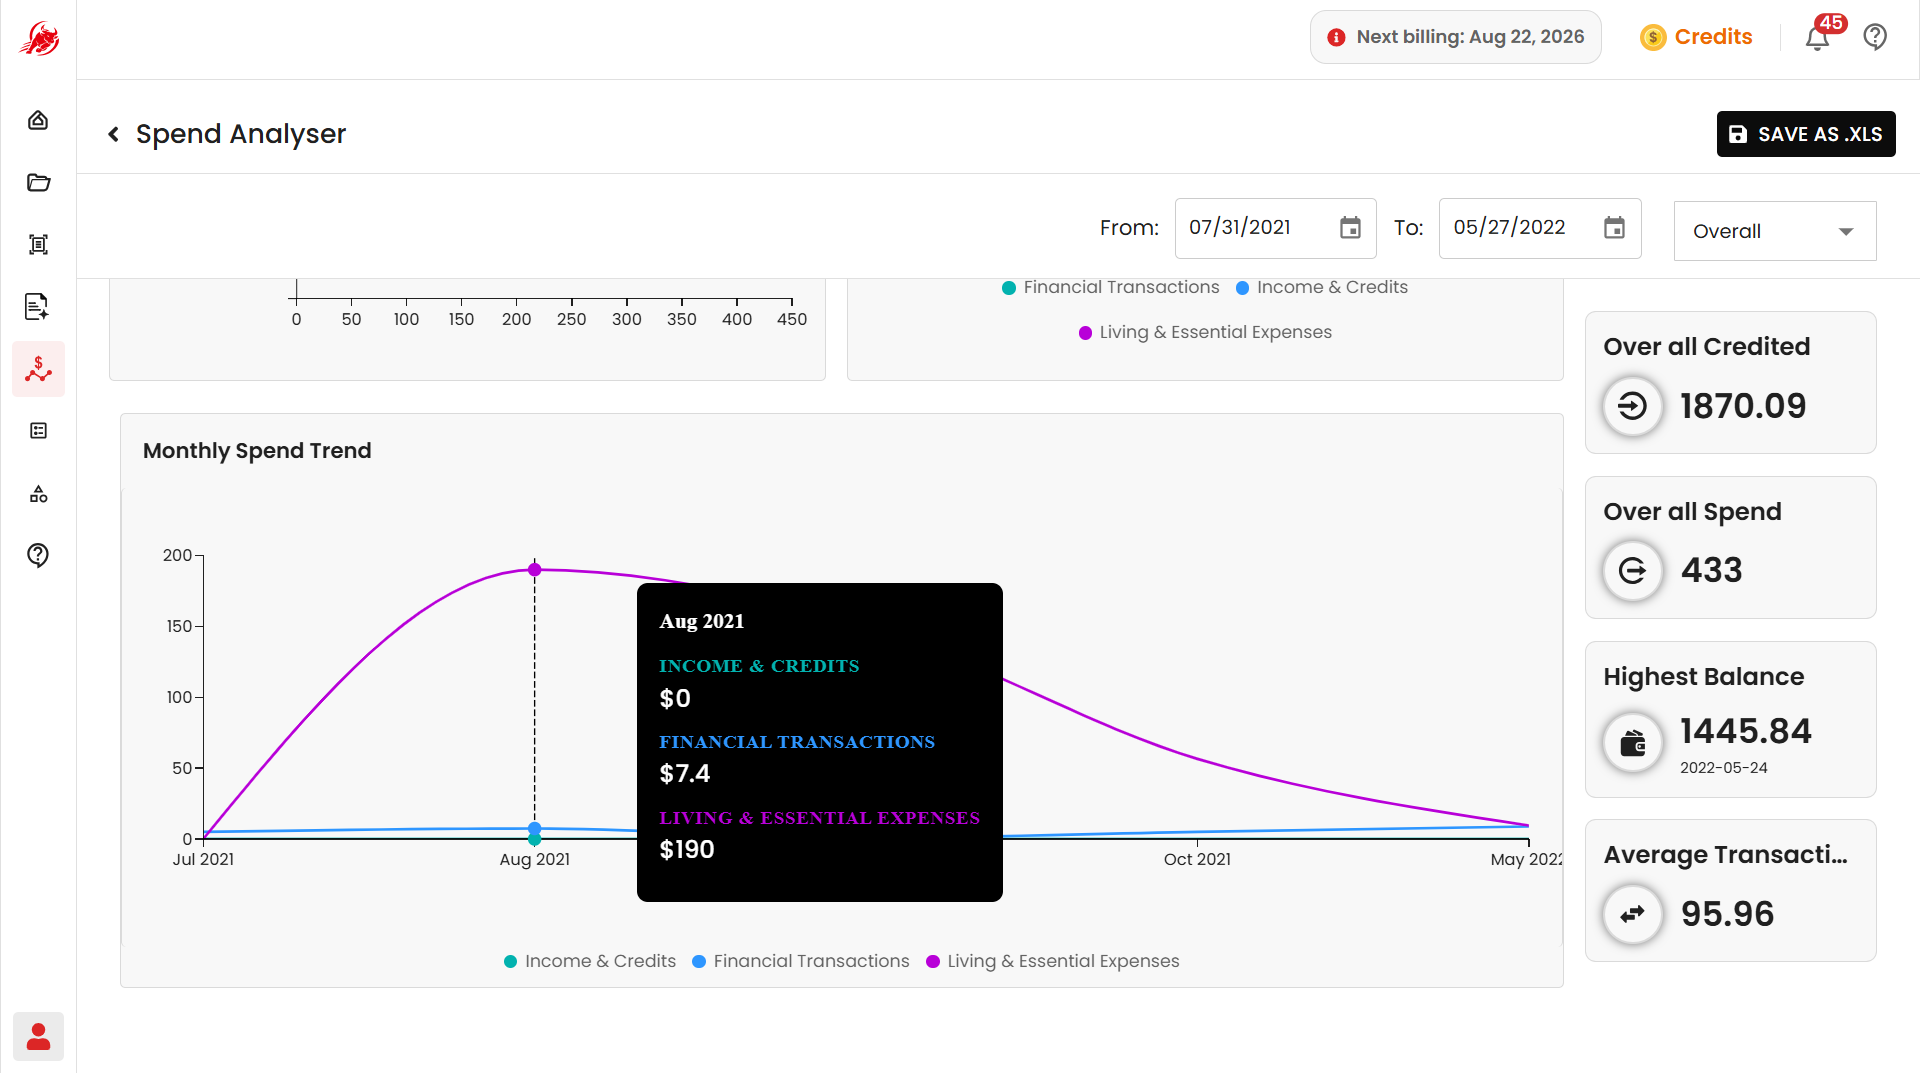
Monthly Spend Trend — total spending by month, to help spot unusually high or low months
If you uploaded more than one bank statement, choose which one to save before downloading.
Save your analysis
Click Save As .XLS to download your report — it includes the charts, the full analysis, and a transaction summary.